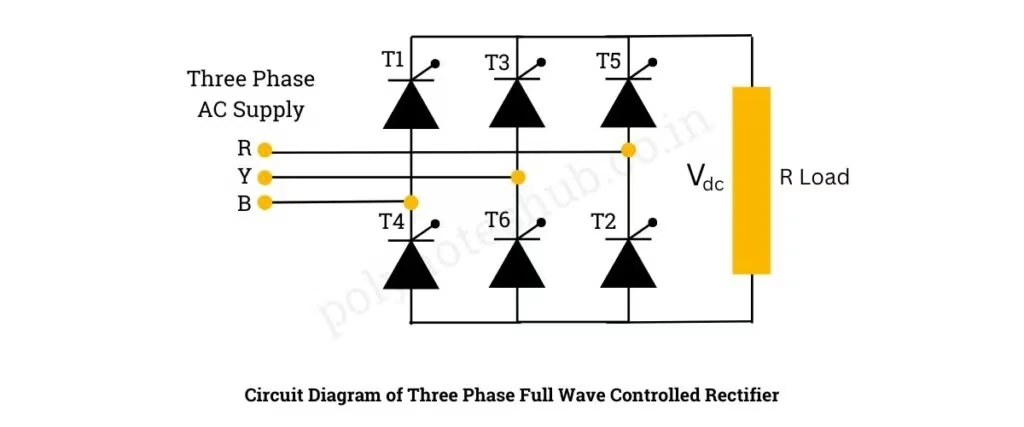
What is a three-phase full-wave controlled (6-pulse) rectifier?
A three-phase fully-controlled bridge replaces the six diodes of the 6-pulse rectifier with six thyristors (SCRs). Each device is triggered a controllable firing angle α after the instant it would naturally begin to conduct — the moment its phase becomes the most positive (top group) or most negative (bottom group). Delaying the firing shifts the conduction window, so the average output voltage falls smoothly as cos α. Beyond 90° the average goes negative and, with an active load, the bridge inverts — returning power to the AC line. It is the standard front-end of large DC motor drives and HVDC.
Output voltage, PIV & ripple
Here Vm is the peak phase (line-to-neutral) voltage. At α = 0 the bridge behaves like the uncontrolled 6-pulse rectifier, Vdc = 3√3·Vm/π. At α = 90° the average output is zero, and for α > 90° it is negative (inversion). This simulator triggers each SCR α after its natural commutation instant, integrates the real load and compares the measured average to (3√3·Vm/π)cos α in the accuracy panel.
Two-quadrant operation & inversion
With a highly inductive load the current is continuous and the output voltage follows the fired line-to-line envelope, which can swing negative for α > 90°. If the load contains an active source (a DC-motor back-EMF or battery — set a negative E), the current keeps flowing and power flows from the DC side to the AC supply: line-commutated inversion, exactly how a DC drive performs regenerative braking. A passive load cannot invert, so its current simply becomes discontinuous at large α — try both in the simulator.
Advanced options in this simulator
- SCR model: add a forward drop
V_fand on-resistanceR_on; the bridge conducts through two SCRs in series, so the total drop is2·V_f + 2·R_on·i. The accuracy check stays locked to the ideal envelope. - Transformer: a turns ratio scales the phase voltage that reaches the bridge.
- Load configuration: resistive, inductive (R-L) or with a back-EMF (R-L-E, signed for inversion).
- Filter & protection: a series-L, shunt-C or LC output filter, an optional RC snubber, and a live protection-margin check of the SCR PIV and average current against the ratings you enter.
- Phase sequence & imbalance: swap the sequence or unbalance the phases and watch the ripple and harmonics change.
- Harmonic spectrum analysis: a real FFT of the output voltage (6th, 12th …) or the AC line current (5th, 7th, 11th, 13th …) with the ripple / THD figure (relative to |DC| so it works in inversion too).
- Export & capture: download the full waveform data as CSV, a text report, or a PNG screenshot of the scope.
Controlled bridge vs uncontrolled bridge
| Feature | 6-pulse uncontrolled | 6-pulse controlled |
|---|---|---|
| Devices | 6 diodes | 6 thyristors |
| Average voltage | 3√3·Vm/π (fixed) | (3√3·Vm/π)cos α (adjustable) |
| Quadrants | 1 (rectify) | 2 (rectify + invert) |
| Ripple frequency | 6f | 6f |
| PIV | √3·Vm | √3·Vm |
See the uncontrolled 6-pulse bridge for the diode version, or the three-phase half-wave controlled rectifier for the 3-pulse SCR version.
Applications
Large DC-motor and traction drives (with regenerative braking), HVDC converter stations, electrochemical plant and any high-power adjustable DC supply. The dual (back-to-back) arrangement of two such bridges gives full four-quadrant control.
Frequently asked questions
What is the average output voltage of a 6-pulse controlled bridge?
Vdc = (3√3·Vm/π)cos α ≈ 1.654·Vm·cos α in continuous conduction, where Vm is the phase peak. It is maximum at α = 0 and zero at α = 90°.
What happens for α greater than 90 degrees?
The average output voltage becomes negative. With an active load the converter inverts — power flows from DC back to the AC supply (regenerative braking). Use the Inversion preset with a negative back-EMF.
What is the PIV of each thyristor?
PIV = √3·Vm — the peak line-to-line voltage.
Which harmonics appear?
Output-voltage harmonics at multiples of 6× the supply frequency; AC line-current harmonics of order 6k±1 (5th, 7th, 11th, 13th …). Raising α increases the harmonic content. Toggle the spectrum panel between voltage and line current.
What causes discontinuous conduction?
A resistive or lightly-inductive load lets the current fall to zero between firings, especially at large α. The simulator flags continuous (CCM) or discontinuous (DCM) conduction and only compares against the (3√3·Vm/π)cos α formula in CCM.